T-cell therapies aid the immune system in eliminating cancer cells. Examples include Chimeric Antigen Receptor (CAR) engineered T-cells, tumor-infiltrating lymphocytes (TIL), and other genetically modified T-cells. Cell therapy has expanded recently, including the 2017 launch of the first CAR T-cell therapies to treat blood cancer, a major milestone in this field.1
Despite its success, developing novel immunotherapies that boost T-cell responses against cancer cells remains challenging, hampered by the lack of powerful in vitro models to assess these immunotherapies throughout their development.
Previously, these models were restricted to suspension cells and 2D cell monolayers.2 The use of CAR T-cells on solid tumors has lagged due to challenges, such as immunosuppressive microenvironments, tumor heterogeneity, and a lack of distinct tumor antigens that CAR-T cells can recognize.
As a result, the ability to screen for CAR T-cells that efficaciously target and kill tumors (e.g. using CRISPR) is an active research area.3
Flow cytometry and image-based techniques are currently used to assess CAR T-cell-induced cytotoxicity. Several groups have published research on the in vitro interaction of T-cells with tumoroids.4
This article describes a workflow for creating 3D tumor spheroids that can be co-cultured with T-cells as a proof-of-concept model for CAR T assays. The activity of activated peripheral blood mononuclear cells (PBMCs) in spheroids was tracked using high-content imaging.
To improve the workflow, an image analysis method used deep learning to precisely segment biological objects of interest and machine learning to quantify T-cell-induced phenotypic changes in spheroids using only brightfield images.
Benefits
- Easily attain 4D (3D + timelapse) datasets using a high-content imager
- Use a machine-learning approach to classify spheroids in a robust manner
- Monitor phenotypic changes in a 3D spheroid model in real time
- Evaluate key features of phenotypic evolution over time
The findings demonstrate the viability of using AI-based analysis workflows to anticipate T-cell efficacy. First, a robust deep-learning model was trained to recognize spheroids and generate masks of the entire spheroids and their edges.
Extracted measurements from the masks were then used to categorize the spheroids using machine-learning approaches, with distinct phenotypic changes observed in the spheroids compared to controls, enabling analysis of T-cell efficacy.
Features like area, total intensity, form factor, and grey level non-uniformity between the different treatment groups were assessed and compared to better understand which features dominate the classification.
Methods
Experiment round-up
The growth of untreated spheroids (control) was compared to that of spheroids mixed with unstimulated PBMCs, and spheroids mixed with stimulated PBMCs. Another control was spheroids treated with the cell-killing agent staurosporine (Figure 1A, 1B).
T-cell interactions with spheroids were captured using time-lapse high-content imaging every 2 hours for 72 hours.
Cell culture
3D Spheroids were created by seeding Hela cells into a 96-well, round-bottom, ultra-low attachment plate (Corning cat # 4515) at a density of 2000 cells per well and cultured at 37 °C for two days.
T-cells were extracted from cryopreserved PBMC vials (ALLCELLS). T-cells were stimulated for six hours with 25 ng/mL PMA and 1µg/mL ionomycin and labeled with CellTracker Green (Thermo Fisher Scientific) before seeding to the 96-well spheroid plate at a 10:1 ratio of the number of Hela cells.5
Figure 1. (A) Workflow. Hela cells were seeded in 96-well round-bottom plate to form spheroids for 2 days. After 2 days, the thawed PBMC/T cells were stimulated in PMA/i for 6 hours before adding to the spheroids for co-culture. The time-lapse live imaging were then performed on spheroids and T cells every two hours. (B) Plate map of the assay. Image Credit: Molecular Devices UK Ltd
Spheroid imaging
Images were captured using the ImageXpress® Micro Confocal High-Content Imaging System and MetaXpress® software with a transmitted light (TL) channel and fluorescent channels. The 3D stack and 2D projection images were captured using a 10× objective and a 10 µm focus step, with time-lapse imaging every two hours and an environmental temperature of 37 °C and 5% CO2. The MetaXpress 6.7.2 software version directly saves 3D stacks in time-lapse (4D) mode into a format compatible with IN Carta® Image Analysis Software.
Image analysis
SINAP, a deep learning-based segmentation module, has been used to train a custom model for precise spheroids segmentation at all time points and treatments. To incorporate all of the conditions, the model was trained using over 50 annotated images and a previously trained organoid base model in Fine-tune mode with 100 epochs.
If no such model is available, default models can be used as the base model and retrained by incorporating more training sets. To enable label-free analysis, masks were created based on the TL channel’s 2D projection.
Data analysis
The extracted measurements for each spheroid were later used to create a model in Phenoglyphs, a machine learning-based classification tool, to classify spheroids into five categories. Python matplotlib was used to plot the trends of key features under different treatments.
Figure 2. TL image of Hela spheroids treated with stimulated T cells (A) at early stage; (B) at middle stage; (C) at late stage; treated with non-stimulated T cells (D) at early stage; (E) at middle stage; (F) at late stage; untreated with T cells (G) at early stage; (H) at middle stage; (I) at late stage; treated with staurosporine (J) at early stage; (K) at middle stage; (L) at late stage. Image Credit: Molecular Devices UK Ltd
Results
T-cell induced phenotypic changes of Hela spheroid
To overcome the challenge of in vitro T-cell evaluation, an image analysis method that uses high-content imaging and analysis was developed to study the interaction of T-cells with tumor cells in 3D assay format (Figure 1). Spheroids were then formed using Hela cells. After 48 hours, activated PBMCs were added to the spheroids, which were imaged every two hours for three days (Figure 3C–K).
After three days of co-culture, several phenotypic changes in the TL-imaged spheroids (Figure 2) were noticed. Spheroids from all treatment groups (except those given staurosporine) grew in size (area) and optical density (become darker). More stimulated T-cells within the spheroids were noticed compared to non-stimulated T-cells (Figures 3C–J), as well as deterioration of spheroid edges (Figures 2C and Figure 5).
Machine-learning-based classification of spheroids
A custom analysis pipeline was created to evaluate phenotypic changes in spheroids using only brightfield images to enhance the workflow for the T-cell-based assay. This method avoids labeling cells before culture, saving both time and money. The 2D projection images in the TL channel (Best Focus Plane) were used to train and create a SINAP model to mask the spheroid region.
Because of the differences in the treatment groups of stimulated T-cells, non-stimulated T-cells, and no T-cells, as well as the different time points (Figure 2), images from all conditions were identified to create a balanced training set.
Since untreated spheroids form smoother boundaries than treated spheroids (Figures 3A–C), different segmentation masks for spheroids and edges were established. Measurements extracted from the resulting masks were then used to create a spheroid classification model in Phenoglyphs (Figure 4D). The pipeline in Phenoglyphs, like that of other AI-based analyses, is outlined below.
Figure 3. (A) Primary Target, Cells and Organelles models used in IN Carta to generate the masks for spheroids and the edge of the spheroids; (B) The mask of the edge (red) and the spheroid (blue) treated with stimulated T cells and nonstimulated T cells at late stage; The fluorescent image blending of mitotracker (spheroid, red) and celltracker (T cells, green) treated with stimulated T cell (C) at 0 hour; (D) at 18 hours; (E) at 48 hours; (F) at 68 hours; treated with unstimulated T cell (G) at 0 hours; (H) at 18 hours; (I) at 48 hours; (J) at 68 hours. Image Credit: Molecular Devices UK Ltd
Step 1: Label the measurements to generate training sets using clustering tool
Before training a classifier model in Phenoglyphs, a clustering tool labels the appropriate classes. The clustering tool depends on the chosen measurements, which may be the same or different from the measurements used in the next step to train the classifier model. The notion that spheroids become darker and less transparent (Figure 2) indicates that intensity-related features may play a significant role in spheroid clustering, also reflected in spheroid maturation.
The investigation contrasted clusters subject to all features to clusters subject to intensity-related features and discovered that the latter case provides better clustering among different conditions, particularly induced T-cells at late stage (Figure 4A pink and cyan label) and unstimulated T-cells at late stage (Figure 4B).
The training sets were then labeled into five categories, including early stage, middle stage, stimulated T-cells late stage, unstimulated T-cells late stage, and no T-cells late stage, and moved on to the next step.
Step 2: Choose top 20 measures and train the classifier model using training sets
After manually labeling the clusters, the ranking tool sorts all measurements with significance scores. To prevent overfitting of the resulting classifier model, the top 20 measurements with a 95% correlation threshold were chosen and the model was trained using a subset of measurements. The measures used in this step differ from those used in the clustering step.
The trained model is applied to the entire dataset. A new set of exemplars, i.e. images, is displayed, with the option to reassign any images to a different class or ignore the outliers. The measurements are all linked to each mask from an image, and when reassigning the images to different classes, the related measurements are also reassigned. This reassignment-training procedure may have to be repeated several times before satisfactory results are obtained (Figure 4C).
Step 3: Examine the classified images
To achieve the goal of correctly classifying the spheroids, the trained model was used to predict all of the spheroids at the final time point. The model correctly predicted 63 of 65 wells (Figure 4E), with a prediction accuracy of approximately 97%. Label-free prediction of spheroid evolution caused by T-cell infiltration is possible with high accuracy using artificial intelligence (AI).
Figure 4. (A) The clustering generated from intensity-related features with 50 clusters (only a subset shown); (B) The clustering generated from all features with 50 clusters (only a subset shown); (C) The final classification generated from the trained phenoglyph model; (D) Screenshot of IN Carta Phenoglyphs classifier; (E) The projected spheroid classification from Phenoglyphs model. Image Credit: Molecular Devices UK Ltd
Measurements of phenotype-related features
The multi-parametric classifier based on machine learning is shown above, which is required due to the complexity of an assay environment in which no single measurement should dominate classification. For example, while intensity measurement may help distinguish images with a carefully chosen threshold in one scenario, it may not work in another when the light exposure time is changed.
As a result, the multi-parametric classification approach based on machine learning is generic in phenotypic analysis. On the other hand, the single measurement-based trend may still provide insight into the biological phenomenon and aid in selecting measurements in the clustering step for future similar assays.
To evaluate how the treatments affect the phenotypes of the spheroids over time, four of the top 20 features: form factor, area, total intensity, and grey level non-uniformity, were plotted throughout the time point (Figure 5).
This section focuses on the divergence of the stimulated curve (blue) from the other curves. Overall, stimulated T-cell curves started diverging at 22 hours for the form factor feature, around 50 hours for total intensity, and 38 hours for grey-level non-uniformity. Between the stimulated and non-stimulated groups, the area feature was the least affected. The overall trends correspond to T-cell penetration, which began around 18 hours (Figures 3C–J).
In the first 40 hours, the area of spheroids treated with T-cells (stimulated and unstimulated) was similar to the negative controls. Following that, the area of T-cell-treated spheroids was substantially more significant than that of control spheroids (Figure 5A). It is possible that the presence of T-cells (both stimulated and unstimulated) influenced the spheroid structure’s integrity.
It was discovered earlier that a larger area is associated with the disintegration of the 3D spheroid structure, resulting in a loose cluster of cells in the well. Spheroids treated with staurosporine show no significant change in size over time, indicating that spheroid growth is inhibited.
The roundness index of an object is designated by the form factor, which has a value range of 0 to 1, with 1 being a circle. Figure 5B shows that the stimulated group has a small but statistically significant change in form factor compared to the negative and staurosporine groups, with p values of.001 and.001, respectively, using the student’s t-test. This trend is expected given that the edges of the simulated T cells treated spheroids are bumpier than the other groups, causing bulge structures around the edges (Figure 3B).
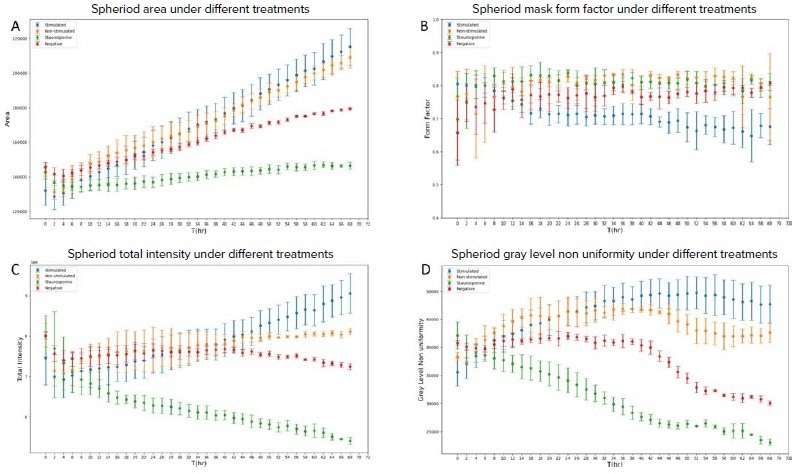
Figure 5. (A) The trend of the spheroid area under different treatments; (B) The trend of the spheroid mask form factor under different treatments; (C) The trend of the spheroid total intensity under different treatments; (D) The trend of the spheroid grey level non uniformity under different treatments. Image Credit: Molecular Devices UK Ltd
Another feature worth mentioning is total intensity. First, because the total intensity is a sum of all the pixel values of the object, a larger total intensity may be expected with a larger object size. In terms of relative values, the results in Figure 5C agreed with that theory, as shown in Figure 5A. Second, because all of the measurements are done in a TL channel, more compact and less transparent structures block more light, resulting in smaller pixel values, which corresponds to the observation that spheroids become opaquer over time, most likely due to increased cell density.
Finally, grey-level non-uniformity (GLNN) is a texture measure that evaluates an object's similarity of grey-level intensity values. A lower GLNN value correlates with greater intensity value similarity. Figure 5D shows that T-cell-treated spheroids have the least similarity, whereas staurosporine-treated spheroids have the most.
Conclusions
- The growth and phenotypic changes of T-cell-treated 3D spheroids were tracked using time-lapse high-content imaging.
- The experiment successfully produced SINAP models to apply masks to the entire spheroid and the spheroid’s edge.
- A Phenoglyphs model was trained to categorize the spheroids into five groups.
- Four key characteristics are highlighted over time, providing useful information for future similar experiments.
References
- CAR T-Cell Therapy Approved for Children, Young Adults with Leukemia - NCI (cancer.gov)
- Jensen C. el al. Is it time to start transitioning from 2D to 3D cell culture? Front. Mol. Biosci., 7:33 (2020).
- Wang D. et al. CRISPR Screening of CAR T Cells and Cancer Stem Cells Reveals Critical Dependencies for Cell-Based Therapies. Cancer Discov. 2021 May;11(5):1192-1211. doi: 10.1158/2159-8290.CD-20-1243. Epub 2020 Dec 16. PMID: 33328215; PMCID: PMC8406797.
- Arno A. et al. Development of an innovative 3D cell culture system to study tumor—stroma interactions in non-small cell lung cancer cells. Plos One. 9 (3), e92511 (2014).
- Wenchao A. et al. Optimal method to stimulate cytokine production and its use in immunotoxicity assessment. Int J Environ Res Public Health. 10(9): 3834-3842 (2013).
About Molecular Devices UK Ltd
Molecular Devices is one of the world’s leading providers of high-performance life science technology. We make advanced scientific discovery possible for academia, pharma, and biotech customers with platforms for high-throughput screening, genomic and cellular analysis, colony selection and microplate detection. From cancer to COVID-19, we've contributed to scientific breakthroughs described in over 230,000 peer-reviewed publications.
Over 160,000 of our innovative solutions are incorporated into laboratories worldwide, enabling scientists to improve productivity and effectiveness – ultimately accelerating research and the development of new therapeutics. Molecular Devices is headquartered in Silicon Valley, Calif., with best-in-class teams around the globe. Over 1,000 associates are guided by our diverse leadership team and female president that prioritize a culture of collaboration, engagement, diversity, and inclusion.
To learn more about how Molecular Devices helps fast-track scientific discovery, visit www.moleculardevices.com.
Sponsored Content Policy: News-Medical.net publishes articles and related content that may be derived from sources where we have existing commercial relationships, provided such content adds value to the core editorial ethos of News-Medical.Net which is to educate and inform site visitors interested in medical research, science, medical devices and treatments.